The report suggests that with the exception of Ireland, Greece, Spain, Latvia, Malta, Romania and England and Wales (UK) all other 20 EU countries reported a 29% drop between 2015 and 2017. However using actual reports received the top three countries for vehicle theft was France with 164’792 reports, Italy with 156’117 and the UK with 96’966 or including Scotland and Northern Ireland 103’611. Bizarrely on average motorcycle, scooter & moped theft totals (those that are known) appear to be around 25% of the overall figure posted for that country, for example in the UK in 2017 car thefts were recorded at 103’611 and 27000 was the total for m/cycles – roughly around 25%. Latest figures (2018) for the UK shows an 8% increase in overall theft on 2017 with 113,037 vehicle thefts reported last year, again showing bikes at 28’259 again around 25%. Similarly 41198 bikes stolen in France from an overall 164’792 and 39029 for Italy from 156’117. Graphic courtesy of Eurostat.
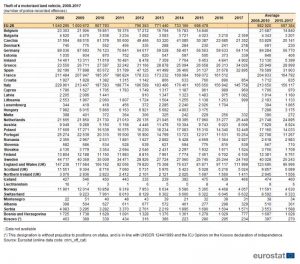
Theft statistics for stolen vehicle in europe